Race Information

One-Day-Classic

Date: April 17, 2024

World-Tour and WWT

Organiser: ASO

Start: Charleroi

Finish: Huy – Mur de Huy

About Safe Cycling Report

Introduction

This report provides a comprehensive analysis of the safety aspects of a prominent cycling race. It aims to dissect the intricacies involved in planning and executing a race that is not only competitive but also ensures the well-being of all riders.

OBJECTIVE

The primary objective is to identify potential risks, and propose actionable solutions to mitigate these dangers. By enhancing safety protocols, we aim to safeguard the health of riders, support staff, and spectators, thereby elevating the overall race experience.


ANALYSIS

Our analysis hinges on evaluating various components such as course layout, weather conditions, obstacle management, and safety plans. We assess past incidents, feedback from participants, and best practices in sports event management to form a holistic view of the race’s safety landscape.

DATA

Data collection encompasses race archives, weather reports, incident logs, and participant surveys. This rich dataset forms the foundation of our safety audit, enabling us to pinpoint vulnerabilities and recommend targeted interventions for future editions of the race.


Methodology

THE RIDERS​


Engaging in discussions with riders and teams to gather their insights. Our surveys have compiled initial data directly from these key stakeholders, ensuring their experiences and concerns are incorporated into our planning.
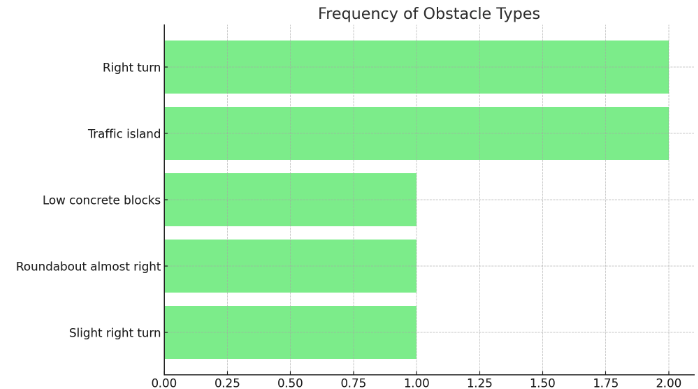


CRASH DATABASE

Utilizing a detailed database to analyze past crashes, identifying common locations and causes. This enables us to pinpoint high-risk areas and devise strategies to mitigate potential accidents.


ORGANISERS


Conducting weekly meetings with race organizers to receive their feedback and incorporate their knowledge into our safety measures. This continuous dialogue helps to align our safety strategies with the specific needs of each event.


SAFE CYCLING

Applying our vast experience gained from over 1000 days of racing to enhance road safety. Our expertise in cycling safety is instrumental in developing effective prevention and response strategies.


OTHERS

Gathering inputs from various stakeholders within the sport, including official bodies, local authorities, and the cycling community at large. This holistic approach ensures a comprehensive understanding of all possible safety concerns and solutions.


Evaluation

SAFETY EVALUATION

This document provides an in-depth analysis of the course, identifying obstacles and potential risks.
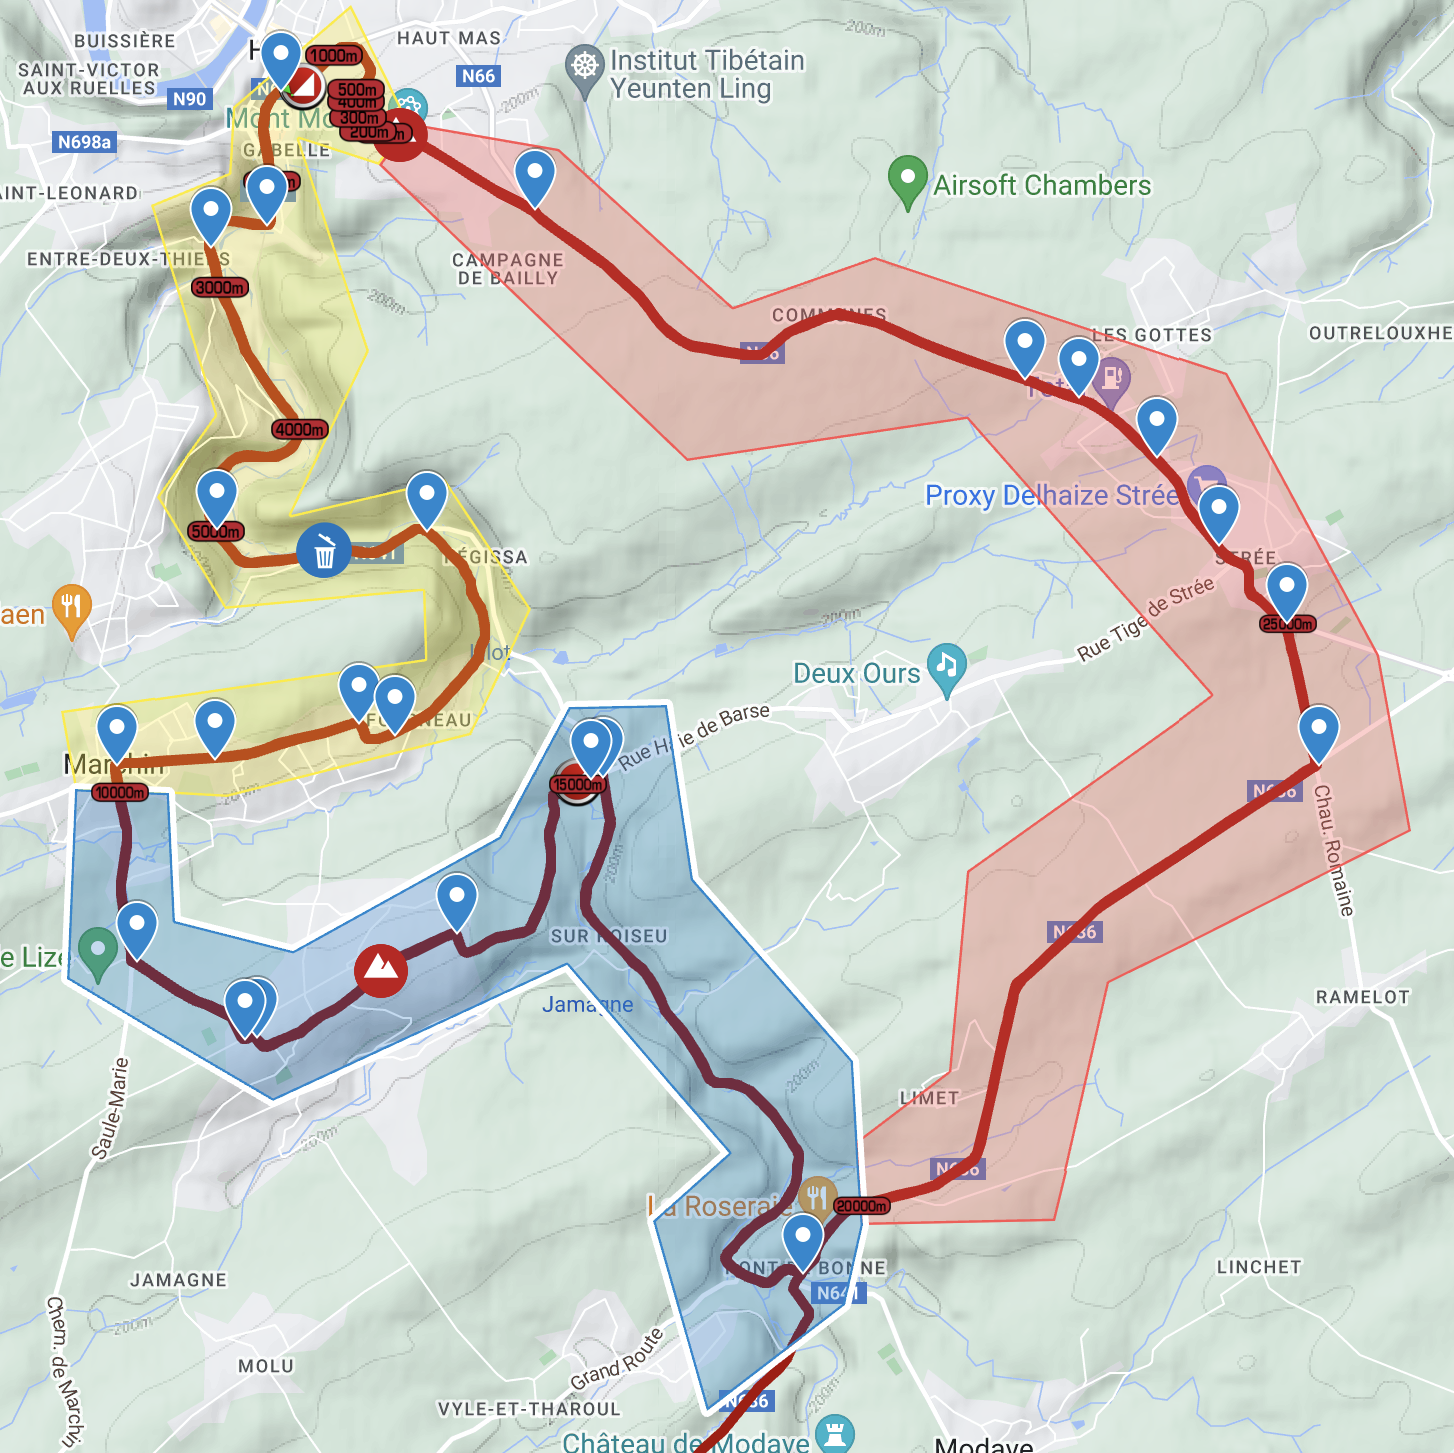

SAFE CYCLING MAP

A comprehensive map detailing the placement of safety equipment, warning systems, and other preventive measures to ensure the well-being of participants and spectators.”


POST-RACE EVALUATION

Focuses on reviewing the events that occurred during the race, identifying both successes and areas for improvement. This includes assessing the effectiveness of the safety measures implemented, gathering feedback from participants, teams, and officials on the course layout and safety protocols, analyzing incident reports to enhance future race safety, and recommending adjustments based on observed outcomes.

Safety Index

COMING SOON

COMING SOON

COMING SOON

COMING SOON

POST-RACE EVALUATION

COMING SOON

Risk Evaluation

Men Race

Info

Women Race

Info

How it was won – Men

2013-2017: The early years saw victories achieved through both solo efforts and group sprints. The average speed varied significantly, peaking in 2014.

2018-2023: This period features a mix of solo wins and sprints. Average speeds generally increased, with 2023 marking the highest at 43.52 km/h.

Crash data becomes more detailed from 2020 onwards, with the number of small crashes and crashes involving 3 or more riders being specifically noted.

The year 2021 saw the highest number of small crashes (4), while 2023 was notable for a significant crash involving 3 or more riders.


How it was won – Women

Year 2020: The race covered 124 km at an average speed of 37.68 km/h, with a profile score of 131, and climbers faced 1920 vertical meters. The startlist had 1376 participants, and the victory was secured through a 0.15 km solo effort.

Year 2021: The distance increased slightly to 130.2 km, with a small decrease in average speed to 37.47 km/h. The profile score rose to 136, and the vertical meters to 2042, with 1314 on the startlist. The race was won by a sprint of a small group.

Year 2022: The race extended to 133.4 km, the average speed dropped to 36.61 km/h, and the profile score jumped to 155. There were 2099 vertical meters to conquer, with the startlist decreasing to 1079, and the average temperature noted at 12°C. The winning method remained a sprint of a small group.

Year 2023: The race was slightly shorter at 127.3 km, with the average speed marginally lower at 36.47 km/h. The profile score was 137, and the vertical meters slightly reduced to 1940, with an increase in the startlist to 1395 participants, and the average temperature was 11°C. The victory was achieved through a 0.2 km solo effort.


Crash Data Men

Crash Data Women

No data from 2020

Startlist Quality and Vertical Meters – Men

Startlist Quality and Vertical Meters – Women

Course Overview

Lorem ipsum dolor sit amet, at mei dolore tritani repudiandae. In his nemore temporibus consequuntur, vim ad prima vivendum consetetur. Viderer feugiat at pro, mea aperiam

Final Lap – Sections

Intro text

We have divided the final 31,6 km into three section

  • Section 1: Last 31,6 – 20 km (red)
  • Section 2: Last 20-10 km (blue)
  • Section 3: Last 10 km (yellow)


Section walktrough

Lorem ipsum dolor sit amet, at mei dolore tritani repudiandae. In his nemore temporibus consequuntur, vim ad prima vivendum consetetur. Viderer feugiat at pro, mea aperiam

Section 1: Last 32-20 km

This section has 7 obstacles with a total danger score of 54, resulting in an average danger score per obstacle of 7.71. The obstacle density is 0.60 per kilometer, with a danger score per km of 4.66.

Roundabout almost right

Information about it:

Warning System: Safety Sign

Section 2: Last 20-10 km

Features 7 obstacles and a slightly higher total danger score of 62. The average danger score per obstacle increases to 8.86, with an obstacle density of 0.70 per km and a danger score per km of 5.34.

Section 3: Last 10 km

This section is the most challenging, with 9 obstacles and a total danger score of 103. The average danger score per obstacle jumps to 11.44, with the highest obstacle density of 0.90 per km and a danger score per km of 8.88.

Plastic Cones in Road

Within the final 10 kilometers, there are two sections where plastic cones are placed in the middle of the road. Both riders and Sport Directors have requested their removal, citing concerns that these obstacles significantly heighten the risk of crashes and incidents.

This website uses cookies. By continuing to use this site, you accept our use of cookies.